
How Damaged QR Codes Stay Scannable | Imagine a traditional barcode on a supermarket food package that gets slightly scratched by a box cutter. The result? The cashier has to manually type in the serial number because the scanner fails to read the data. However, this scenario almost never happens with a QR code. You might often see these unique square codes pasted on street utility poles, torn, covered in mud splatters, or even deliberately vandalized, yet amazingly, your phone can still detect them in the blink of an eye.
This extraordinary survival capability is neither a coincidence nor technological magic. Behind that combination of random pixels lies a highly ingenious mathematical defense system called Error Correction Coding (ECC). This feature is the unsung hero, ensuring the information inside the square is accurately delivered even when its physical form is badly damaged.
For business owners, designers, and everyday users alike, understanding how this internal architecture works will change the way we view this simple technology that we use every single day.
The 4 Levels of Resilience: Measuring the Limits of QR Code Damage
Every time a QR code is created through a generator, the system automatically embeds a specific damage tolerance level. This flexibility is divided into four standard levels, each determining how much of the code’s visual pattern can be lost without breaking its functionality.
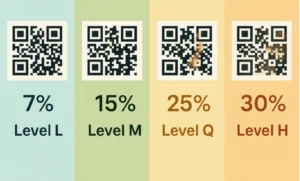
Level L (Low)
At this tier, the code is designed with high space efficiency but offers the lowest defense. The system can only recover lost or damaged data up to 7%. Level L is typically used on digital mediums such as monitor screens or high-specification PDF documents, where physical risks like tearing or scratching are virtually nonexistent.
Level M (Medium)
This is the standard default setting most commonly encountered in daily life. With the ability to recover up to 15% of damaged data, Level M offers a perfect balance between the density of the square pattern and durability. This type of code is ideal for brochures, business cards, or restaurant menus kept indoors.
Level Q (Quartile)
When a code needs to be printed on surfaces that are frequently touched or placed in semi-outdoor environments, Level Q is a wise choice. This tier can reconstruct missing information up to 25%. The logistics and supply chain industries frequently utilize this level because shipping packages are prone to friction during warehouse distribution.
Level H (High)
This is the highest tier in terms of visual data protection, where the code remains scannable even if its physical appearance is ruined or missing up to 30%. Level H serves as the primary shield for extreme use in outdoor environments exposed to harsh weather, rain, or rough abrasions on heavy industrial product packaging.
However, a technological trade-off applies here. The higher the error correction level you choose (such as Level H), the denser and more complex the arrangement of tiny pixel squares inside it becomes. This happens because the system requires extra space to store the redundant backup data. Consequently, the physical print size must be adjusted so that older phone cameras do not struggle to capture the highly compact pixel details.
The Ingenious Mechanism Behind Data Recovery
How is it possible for a static image to program itself to “heal” when read by a camera? The secret lies in two main pillars embedded within the code’s system: information redundancy techniques and advanced mathematical algorithms.
The Data Redundancy System
The fundamental principle behind this resilience is actually quite simple: replication. When data is written into a QR code, the information is not just written once in one place. The system breaks that data down and writes it repeatedly across different areas of the grid.
To use an analogy, it is as if you made multiple copies of an important document and scattered them across several different desk drawers. If the top-right drawer is destroyed by an impact, the computer or scanning application on your phone will not panic. It simply checks the bottom-left or center drawers to retrieve the exact same pieces of information. As long as these backup sections remain intact, the original information can still be reassembled perfectly.
The Magic of the Reed-Solomon Algorithm
While the redundancy technique is responsible for providing backup copies, the Reed-Solomon Algorithm is the brain that works to piece those fragments back together. This advanced mathematical algorithm was originally developed for satellite communications and digital disc storage (CDs/DVDs) to prevent audio and video from skipping when a disc got scratched.
When your phone camera targets a damaged black-and-white square, this algorithm acts like a detective solving a crossword puzzle. It analyzes the remaining surviving pixels, calculates the mathematical probabilities, and instantly “fills in the blanks” for the missing parts.
This intricate process is very similar to how the human brain reads a sentence with missing letters. When you see the text “G-o-d M-r-n-n-g”, your brain automatically knows the phrase is “Good Morning”. The algorithm does the exact same thing for computer code in a fraction of a second.
A Creative Touch: Utilizing Damage Tolerance for Aesthetics
The fascinating aspect of this damage tolerance feature has given birth to a new trend in digital marketing and graphic design: visual customization. Because scanning systems can tolerate data loss up to 30%, designers purposely exploit this “official damage window” to insert aesthetic elements.
This is exactly where corporate logos, social media icons, or mini illustrations can be placed right in the center of the square without breaking its original scanning functionality. Modern generators treat the logo in the center as a form of artificial “damage” covering the primary pixels.
Automatically, thanks to the heavy lifting of Level Q or Level H, the system shifts and strengthens the data covered by the logo to the outer edges of the grid. The end result is an interactive marketing tool that looks highly professional, branded, yet remains incredibly responsive when scanned by consumers.
Practical Guide to Choosing the Right Encoding Level
Choosing the right error correction level is not just a matter of picking the highest percentage. Improper usage can actually make your code too dense and difficult to read for older phone models whose cameras lack advanced sensors. Here is a practical guide based on real-world conditions:
-
Outdoor Media (Billboards, Banners, Street Posters): It is highly recommended to use Level H. Weather factors, direct sunlight fading the ink, and the risk of vandalism demand maximum protection so your promotional investment does not go to waste.
-
Wholesale Product Packaging and Logistics: Opt for Level Q or Level M. Cardboard boxes stacked inside delivery trucks are highly prone to heavy friction that can scrape off the outer printed layer.
-
Business Branding Needs (Logo Customization): Always select Level H or at least Level Q. Inserting a visual identity in the center requires a large data compensation space so that the remaining pixels around the logo still carry valid link instructions.
-
Administrative and Digital Needs (E-Tickets, Presentation Screens): Simply use Level L. Using a lower level keeps the square pattern simple, clean, minimalist, and exceptionally fast to load on any type of digital screen.
This technology proves that the efficiency of a system is measured not only by how fast it works under normal conditions, but by how resiliently it endures and recovers when real-world situations are far from perfect. Through a solid foundation of mathematics, this humble square will continue to be a reliable bridge of information across various industries.